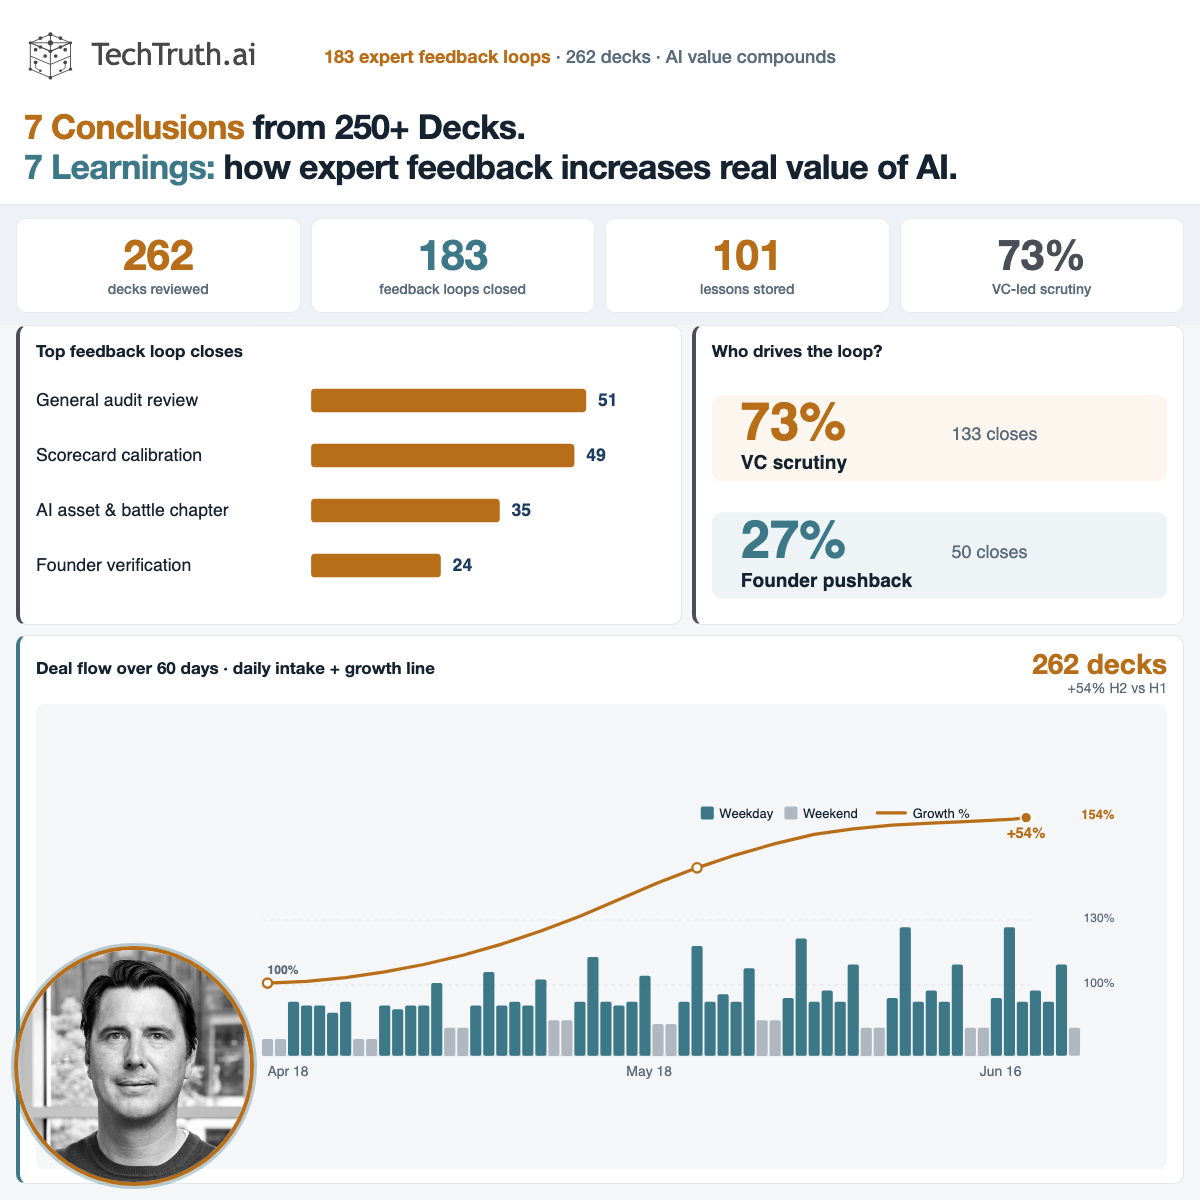
Between 2026-04-18 and 2026-06-16 we processed 262 pitch decks through TechTruth — 183 expert feedback loops, calibrated across industry, deal size, maturity stage, AI class. Below: what that volume actually teaches, not what a single deck meeting would.
Last 60 days · live intake
262 decks
183 feedback loops · avg 4.4/day
Tool improvement
9%AI class resolved now
↑vs early pipeline months
Red vs blue team
25red team closes
10blue team closes
Feedback tension
73%VC scrutiny
27%founder pushback
Weekday vs weekend
5.5weekday avg
1.8weekend avg
Reality gaps
54%wrapper signal
44%founder claim gap
Classification + climate depth
20% climate/energy mix in benchmarks · feedback loops compound per vertical
This post is built from anonymized benchmark scorecards (107 companies with full executive scorecards) plus live intake telemetry from the last 60 days. The headline number is 262 decks — slightly above 250 — because deal flow in climate, energy, and AI-heavy software has not slowed down.
Below: seven conclusions on the decks themselves, then seven on the feedback loops — each followed by a short bridge paragraph and, where it helps, a compact chart. No separate appendix of duplicate graphs.
7 conclusions about the decks
What 262 pitch decks in 60 days show — verdicts, sectors, AI claims, intake rhythm, and where conviction breaks.
01
Cautious is the default — and that is the point
53.3% of benchmark decks land in Cautious verdict territory. That is not a bearish market call — it marks teams that are directionally credible but still light on proof. The best investors use Cautious as a structured pause: which pillar, if fixed, would move this to Optimistic?
Optimistic and Strong verdicts exist — but they are the exception. Most decks sit in a grey zone where one more data point on moat or infrastructure would shift the meeting.
Verdict distribution (benchmark scorecards)
02
Founders win the narrative; technology still has to win the room
Founder Team averages 6.9/10 — the highest scorecard pillar. Technical Moat (5.5), AI Asset Depth (4.7), and Infrastructure (4.8) trail behind. Decks are polished. The diligence conversation has moved from ‘strong team’ to ‘show me what compounds.’
We see the same split in every sector: charismatic founders with slides that outrun the repo. The scorecard is designed to surface that gap explicitly — not to punish storytelling, but to locate risk.
Executive scorecard pillars (mean ×10)
03
Wrapper language is still everywhere (32.7% Pure Wrapper)
Nearly one in three decks classifies as Pure Wrapper — the largest AI-class bucket in the set. Many are viable businesses. The gap is not ambition; it is defensibility: workflow lock-in, proprietary data, or distribution — not ‘agent’ vocabulary on slide three.
‘Agentic’ replaced ‘AI-powered’ as the default adjective in 2025–2026. The classification loop exists precisely because narrative upgrades faster than architecture.
The same pattern shows up in AI security: across 267 decks in the benchmark set, 3 cite Deeploy-style guardian agents as proof — prompt-injection defence, guardrails, and related controls — often marketed ahead of a production trace or threat model we could verify in diligence.
AI class mix
04
Climate and energy punch above their weight
21 climate and energy decks make up 19.6% of the benchmark mix — disproportionate to general tech (44.9% in pure software). Grid, storage, and industrial AI attract heavier technical scrutiny; decks in this vertical face a higher proof bar by default.
44 learned lessons are already tagged energy or climate — the vertical where feedback loops closed fastest. Hardware-adjacent claims (grid, storage, sensing) trigger more battle-chapter overrides than pure SaaS.
Industry mix
05
Deal flow is accelerating — but it respects the calendar
262 decks in 60 days (4.4/day average). Weekdays: 5.5/day. Weekends: 1.8/day. Second-half volume is +54% vs the first half — pipeline is growing, not flat.
VC partners batch-review Tuesday through Thursday. Founders upload Sunday night. The intake chart is not noise — it is how the market actually behaves, and the benchmark window reflects that.
60-day intake — weekdays vs weekends
06
Most decks arrive via Angel syndicates (15.6%)
The largest intake channel in the 60-day window is Angel syndicates & individual angels at 15.6% of volume. Angel syndicates and founder-direct referrals fill the rest. Diligence quality matters most when deal flow is diversified — the same red flags show up regardless of who forwarded the deck.
Channel mix shapes urgency, not truth. A founder-direct deck and a VC-forwarded deck fail for the same technical reasons — thin moat, missing data strategy, wrapper claims — even when the intro email sounds completely different.
Deck sources (60 days)
07
The recurring reality gap: moat appears thin or wrapper-like
Reality-gap tables flag where narrative outruns evidence. The most repeated theme: moat appears thin or wrapper-like. Mean WCCAA sits at 6.3/10 — not weak, but uneven. Proof is often present somewhere in the data room; it is rarely assembled as one auditable story in the deck.
That concludes the deck-side picture: strong stories, uneven proof, wrappers still common, energy decks held to a higher bar. What changes next is not the deck — it is whether the diligence engine learns from every override.
WCCAA score distribution
7 conclusions about the feedback loops
What 183 human feedback loops teach — how the tool improves over time, how VCs and founders pull in opposite directions, and why red vs blue team overrides matter.
01
There are five loops — not one generic human review
TechTruth runs separate feedback loops for scorecard calibration, founder verification, AI battle chapters, reality-gap annotations, and classification tagging. In the last 60 days they closed 183 times — each override is scoped to the part of the audit it corrects.
A single ‘thumbs down’ on a PDF would not scale across 262 decks. Scoped loops let an expert fix classification without rewriting the entire battle chapter — and vice versa.
Feedback loop closes by type
02
Volume scales with decks — and pulls both ways
183 feedback loops on 262 decks (~70% review ratio, same as techtruth.ai). 72.7% of overrides reflect the investor lens — scorecard harshness, moat scepticism, wrapper detection. 27.3% reflect founder-side pushback — verification disputes, blue-team defences of technical depth. The loop is bidirectional: VCs push the model stricter; founders push it fairer.
VCs most often challenge AI depth, generous moat scores, and missing diligence questions. Founders most often challenge false-positive founder flags and harsh blue/red battle outcomes. Both are signal — the model learns from the tension, not from one side winning.
Who drove the override? (60 days)
03
Classification resolution is the clearest before/after
Resolved AI class share rose from 0% to 53% as classification loops closed. 9.4% of benchmark decks now carry a definitive AI class. Early runs defaulted to narrative; expert tagging on industry and AI depth is what moved the needle.
This is the most visible proof that the tool improves: not marketing copy, but a metric that moved because humans corrected industry and AI-depth tags hundreds of times.
Loops closed (bars) vs AI class resolved % (line)
04
Scorecard loop: 49 closes in 60 days
Scorecard & WCCAA calibration accounts for 26.9% of loop volume (49 closes). When an expert shifts a pillar score or WCCAA weight, that calibration propagates — a 7/10 means something different for a pre-seed wrapper vs a Series A deep-tech deck.
Calibration is contextual: stage, sector, AI class, and deal size all shift what ‘good’ looks like. That is why the same numeric score on two decks can imply opposite conviction levels.
05
Founder verification loop: 24 closes
Founder verification drove 24 loop closes (13.1% of the total). LinkedIn role mismatches, missing GitHub evidence, and distributor-vs-founder confusion get corrected once — then similar patterns are caught earlier on the next deck.
Founder verification is where founder-side feedback concentrates. A corrected false positive on one deck teaches the extractor to ignore distributor signatories on the next.
06
Energy is the most loop-trained industry (44 lessons)
44 distilled lessons are tagged energy or climate — more than any other vertical. Classification & industry tagging alone closed 10 loops (5.4%). Climate decks benefit most from accumulated overrides; the model has seen more edge cases there.
When a grid-storage deck is mis-tagged as fintech, an expert override does not just fix one row — it becomes a retrieved lesson the next time a battery software deck mentions payments in passing.
Resolved AI class share by month
07
Red team vs blue team — the battle chapter matters
Every audit runs a Red Team (sceptical investor) and Blue Team (founder advocate) on technical claims. In the 60-day window: 25 red-side and 10 blue-side battle loop closes. Overrides typically target wrapper depth, moat language, or missing infrastructure — and feed learned lessons for the next deck.
Red team asks ‘where does this break under sceptical diligence?’ Blue team asks ‘what context did the model miss?’ 101 distilled lessons now sit in the store — each one a past argument both sides already had.
Red team vs blue team loop closes
Takeaway: decks are getting slicker; proof layers are not keeping pace. The difference is whether your diligence stack learns — through five scoped loops, battle-chapter tension, and overrides that compound into the next 262 decks.